Loading application, please wait...
Problems loading? Make sure you have a recent version of Google Chrome, Firefox, Safari or Microsoft Edge installed.
WebPlotDigitizer
Unstable version warning!
You are using a beta version of WebPlotDigitizer. There may be some issues with the software that are expected.
Import JSON/Project
JSON/Project data has been loaded!
Invalid Inputs
Please enter valid values for calibration.
Invalid Log Scale Value
Values on a log scale axis can not be zero as log(0) is undefined. Please enter a non-zero value.
Acquire Data
Please calibrate the axes before acquiring data.
Clear data points?
This will delete all data points from this dataset
Webcam Capture
Your browser does not support webcam capture using HTML5 APIs. A recent version of Google Chrome is recommended.
Transformation Equations
Transformation equations are available only after axes have been calibrated.
Unsupported Feature!
This feature has not been implemented in the current version. This may be available in a future release.
Processing
ERROR: Invalid File!
Please load a valid image file. Common image formats such as JPG, PNG, BMP, GIF etc. should work. Word documents are not accepted.
Raw
Nearest Neighbor
Manage Datasets
Please calibrate the axes before managing datasets.
Delete Dataset
Are you sure you want to delete this dataset?
Delete Axes
Are you sure you want to delete this axes?
Averaging Window
X Step w/ Interpolation
Custom Independents
X Step
Blob Detector
Histogram
Specify Plot (Foreground) Color
Specify Background Color
Please add some data before exporting.
Error: No datasets to export!
Add Dataset Error!
Rename Dataset Error!
Dataset with this name already exists. Please pick a different name.
Rename Axes Error!
Axes with this name already exists. Please pick a different name.
Specify a valid number of datasets to add!
Dataset
Datasets
Measurements
Axes
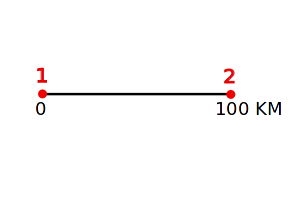
Distance
Angle
Area/Perimeter
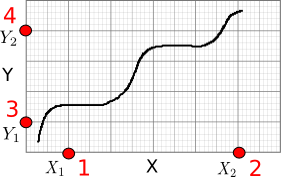
XY
Image
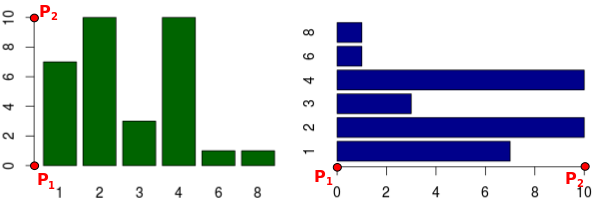
Bar
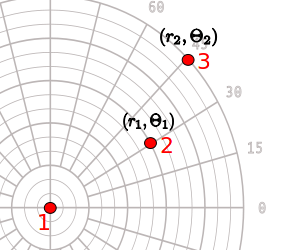
Polar
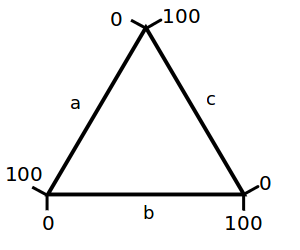
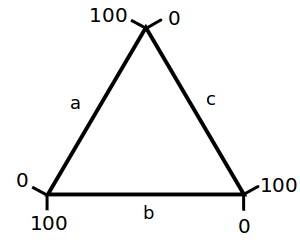
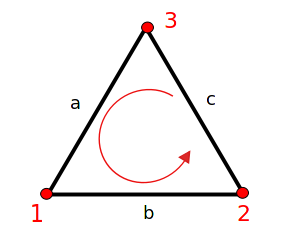
Ternary
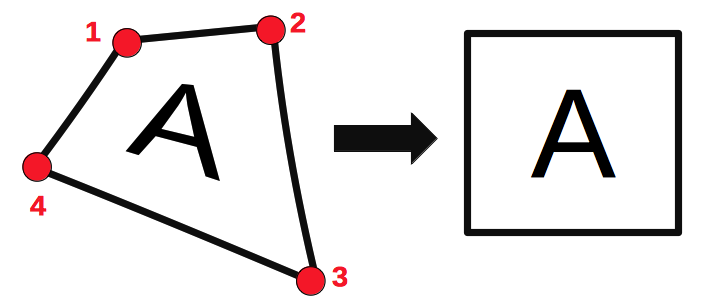
Map
Project
Distance Measurements
Angle Measurements
Area Measurements
Uncalibrated Dataset!
Assign an axes calibration to this dataset!
Invalid Project!
Not a valid project file format!
Image
of
Page
OK
Cancel
Yes
No
Delete Point Tuple
Delete all points in the tuple?
Delete Group
Delete all points in deleted groups?
Group
Delete Group
Primary Group
new tuple